Extreme Climate Analysis in California

Compound extreme events in California

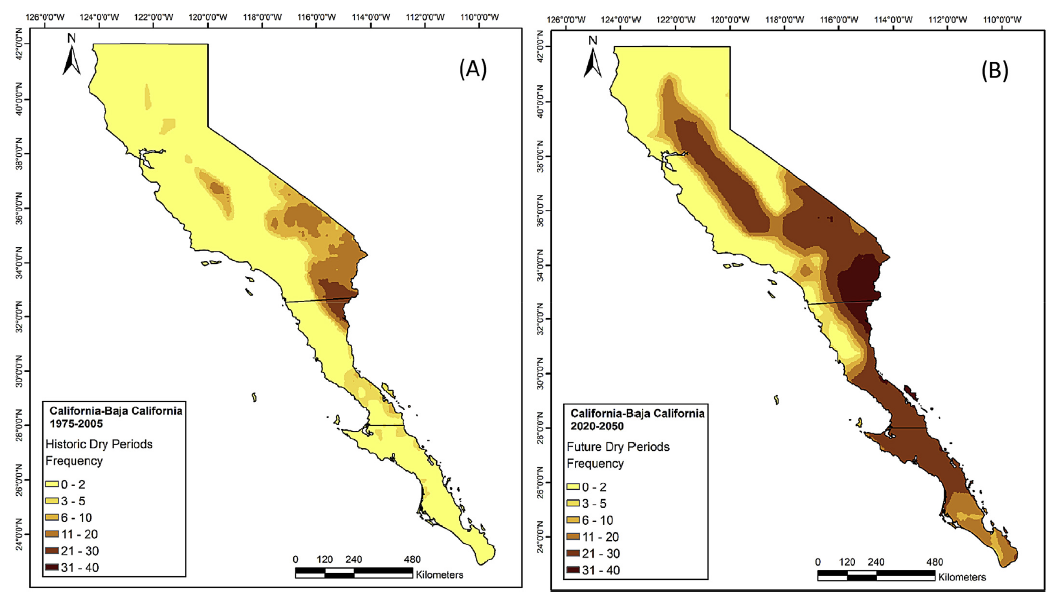
Application of our Climate Change Toolkit (CCT) in California using ensemble results of scenario RCP8.5 showed a probable increase in the frequency of dry periods in the southern part of the region while decreasing in the north. 

Climate change impacts on extreme events

We developed a tool to predict extreme climatic events by analyzing historical weather patterns in this project. Application of this method in California using ensemble results of scenario RCP8.5 showed a probable increase in the frequency of dry periods in the southern part of the region while decreasing in the north. The frequency of wet periods may suggest higher risks of flooding in the north and coastal strips. We further found that every county in northern California may experience flooding conditions of 1986 at least once between 2020 and 2050.


Climate change is now widely recognized as one of the major 21st-century environmental problems facing the globe. Atmosphere-Ocean General Circulation Models (GCMs) suggest that rising concentrations of greenhouse gases will have significant implications for climate worldwide (IPCC). Assessment of the climate change impact and mitigation at both global and regional scales has attracted the attention of decision-makers, researchers, and stakeholders.


We development of a Climate Change Toolkit (CCT) program to perform tasks needed in a climate change study plus projection of extreme weather conditions by analyzing historical weather patterns. CCT consists of Data Extraction, Global Climate Data Management, Bias Correction, and Statistical Downscaling, Spatial Interpolation, and Critical Consecutive Day Analyzer (CCDA). CCDA uses a customized data mining approach to recognize spatial and temporal patterns of extreme events. CCT is linked to an archive of 0.5 historical global daily datasets (CRU, 1970-2005), and GCM data (1960-2099) for five models and four carbon scenarios.

The frequency of wet periods may suggest higher risks of flooding in the north and coastal strips. We further found that every county in northern California may experience flooding conditions of 1986 at least once between 2020 and 2050.


Climate Change impacts on Extreme events in California

 Application of CCT in California using ensemble results of scenario RCP8.5 showed a probable increase in the frequency of dry periods in the southern part of the region while decreasing in the north. The frequency of wet periods may suggest higher risks of flooding in the north and coastal strips. We further found that every county in northern California may experience flooding conditions of 1986 at least once between 2020 and 2050.


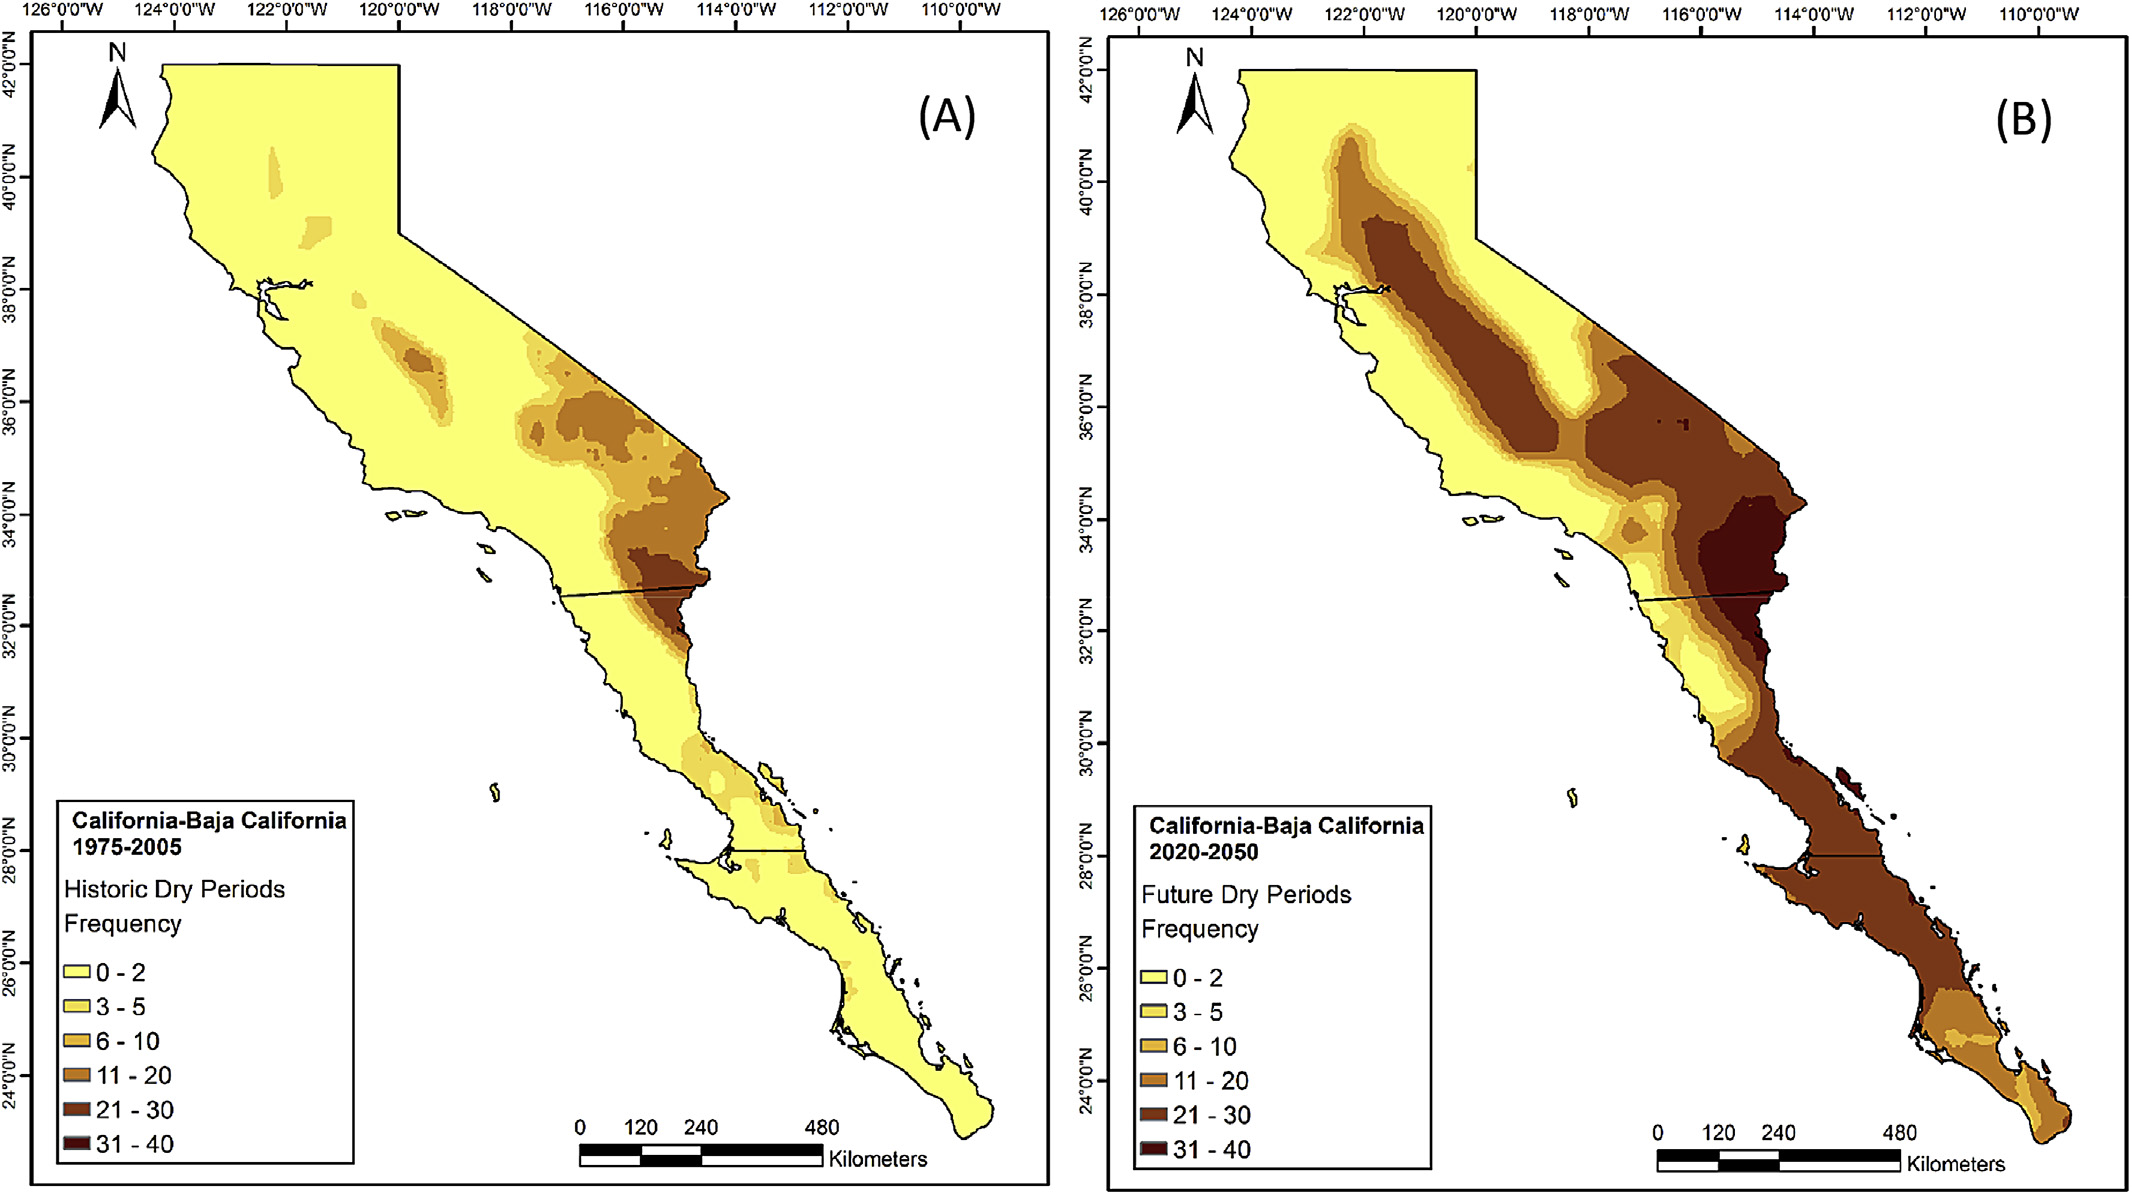
(A) Outputs of the Critical Consecutive Day Analyzer (CCDA) for dry days. Maps show frequency of 60 consecutive days where rainfall <2 mm and maximum temperature >30 oC for the 1975-2005 period, and (B) 2020-2050 period. Future dry-day periods were calculated as the ensemble of five GCMs for the RCP8.5 scenario.


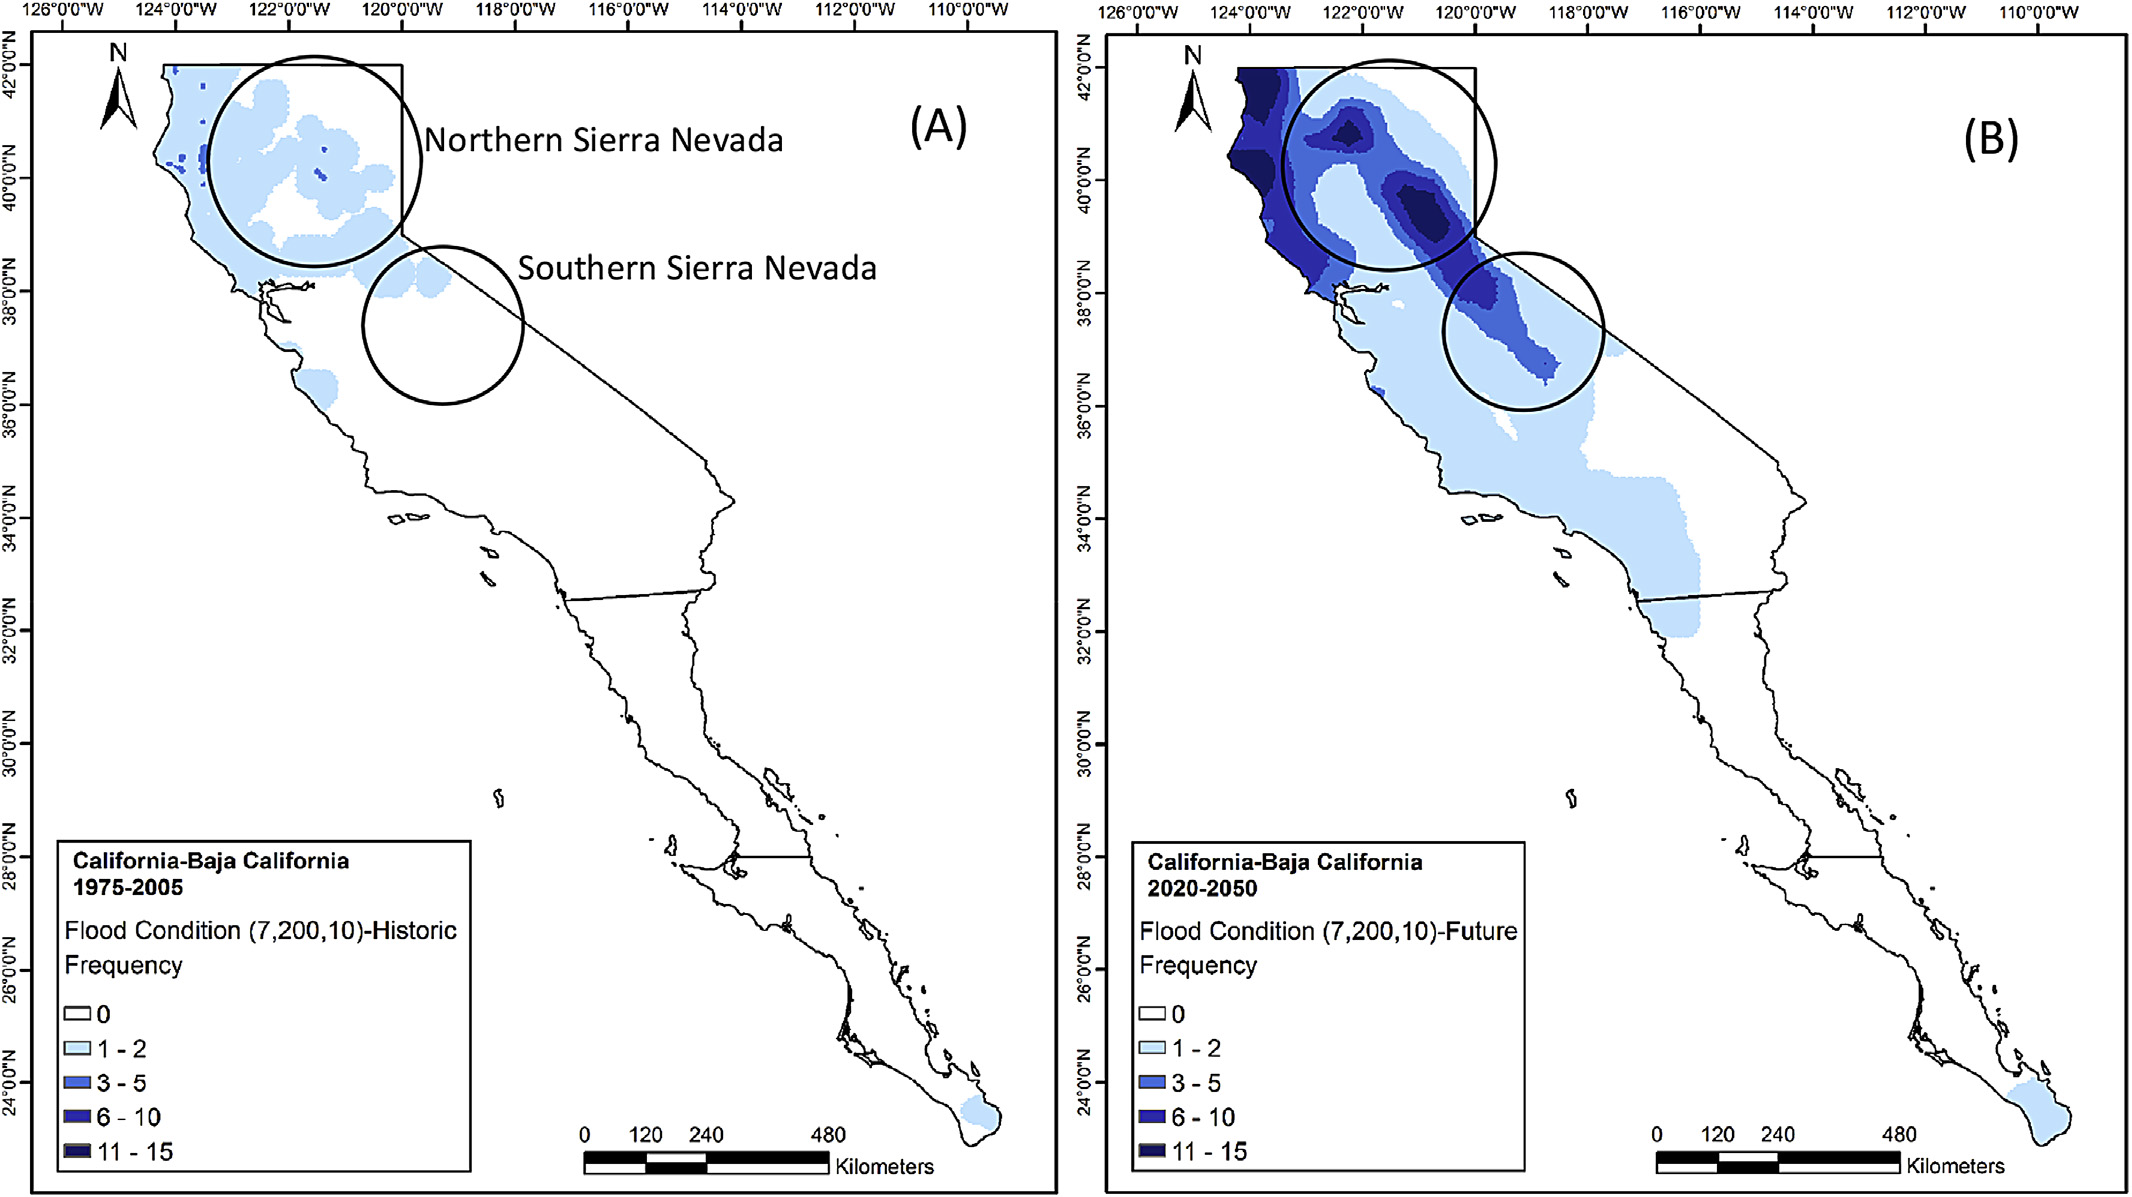
Projection of the historic flooding conditions of February 1986 in Northern California-Sacramento (11 continuous days of rainfall > 250 mm) to future (7 continuous days of rainfall > 200 mm with minimum daily rainfall > 10 mm/day). (A) Frequencies for the 1975-2005 period, and (B) for the 2020-2050 period using the RCP8.5 scenario.