A Continental-scale Hydrologic and Water Quality Model for Europe
Ecohydrological Model of Europe
Water Resource Assessment in Europe
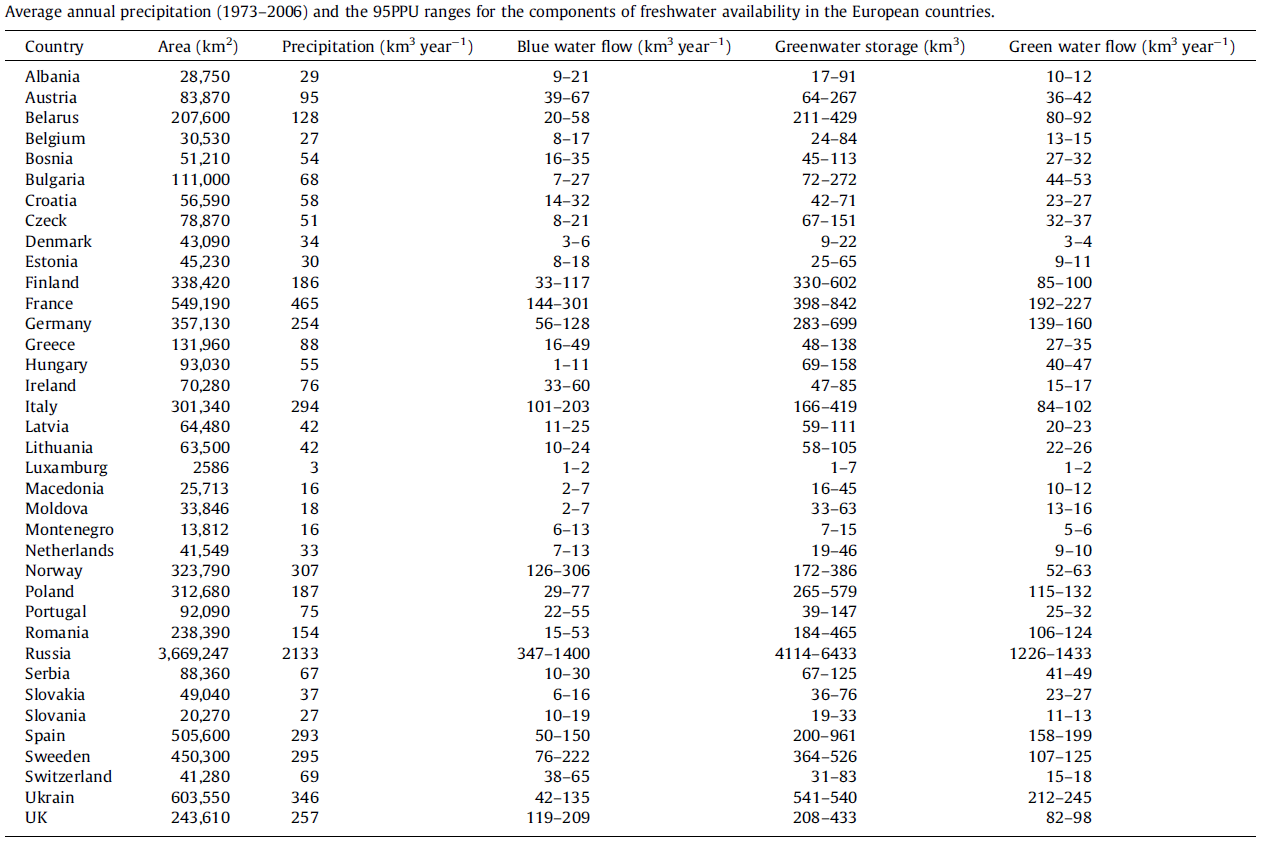
In many parts of Europe, groundwater quantity, particularly quality, has severely degraded, and water levels have decreased, resulting in adverse environmental impacts. Rapid improvements in the economy of the eastern European block of countries and uncertainties concerning freshwater availability create challenges for water managers. At the same time, climate change adds a new level of uncertainty about freshwater supplies. In this research, we build and calibrate an integrated hydrological model of Europe using the Soil and Water Assessment Tool (SWAT) program. Different components of water resources are simulated, and crop yield and water quality are considered at the Hydrological Response Unit (HRU) level. The water resources are quantified at the subbasin level with monthly time intervals. Nitrate leaching into groundwater is also simulated at a more refined spatial level (HRU). The use of large-scale, high-resolution water resources models enables the consistent and comprehensive examination of integrated system behavior through physically based, data-driven simulation. The calibrated model and results provide information support to the European Water Framework Directive and lay the basis for further assessment of the impact of climate change on water availability and quality. The approach and methods developed are general and can be applied to any large region worldwide.
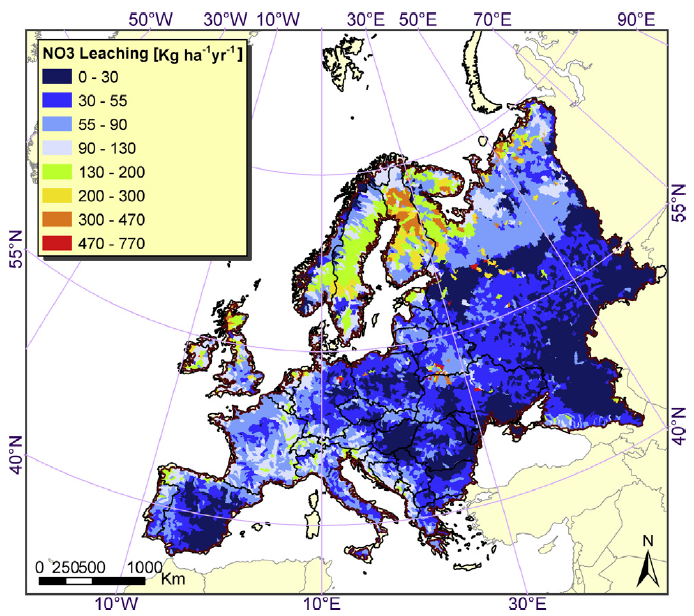
Map of nitrate leaching from the bottom of
the root zone. The image mostly reflects nitrate leaching from the organic
constituent of the soil and underestimates the leaching of nitrogen due to
excess fertilizer application and application of manure.
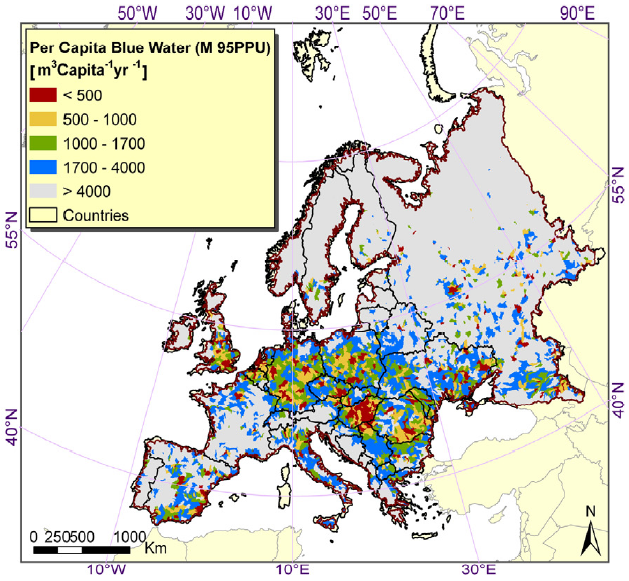
Water scarcity map across Europe based on
the Falkenmark’s threshold of 1700 m3 capita-1 year-1.
The difference between the lower and the upper bounds of model prediction
uncertainty highlight the importance of calculating and reporting model
prediction uncertainty.